

Real estate market statistics — Belgrade
Selected
Tap a region, a bar or a table row to inspect it.Click a region to inspect · shift-click to compare.
Permits over time
Belgrade: 2019 – 2025
Supply pipeline
Dwellings permitted vs completed — the gap is the build backlog.
Backlog · 2025: +3,521
Rank movement
How each municipality's rank shifted over time — click a point to select.
17 municipalities of Belgrade
Municipality ranking
Tap to select · tap rows in the table below to compare.Click to select · shift-click to add — here or on the map.
17 municipalities of Belgrade
Above & below average
% difference from the median municipality — tap to select, or tap rows in the table below to compare.% difference from the median municipality — click to select, shift-click to add.
17 municipalities of Belgrade
Distribution
Each dot is an area — tap to select, or tap rows in the table below to compare.Each dot is an area — click to select, shift-click to add.
17 municipalities of Belgrade
Affordability
Each bubble is a municipality — €/m² vs salary, size = population. Click to select.
Composition
Each segment is a share of the total shown — tap to select.Each segment is a share of the total shown — click to select, shift-click to add.
Compare
Select a region on the map or a bar to compare.
17 municipalities of Belgrade
- All municipalities
- 14,615Building permits (year)
- Selected
- Select a region on the map or a bar to compare.
Municipality
17 municipalities of Belgrade
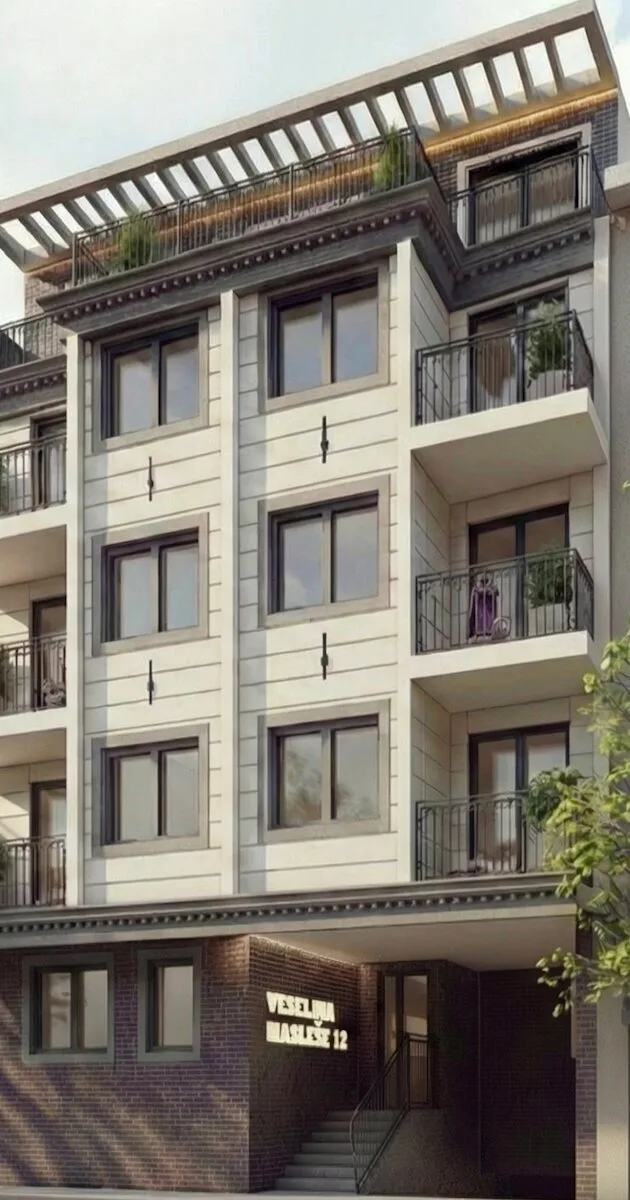
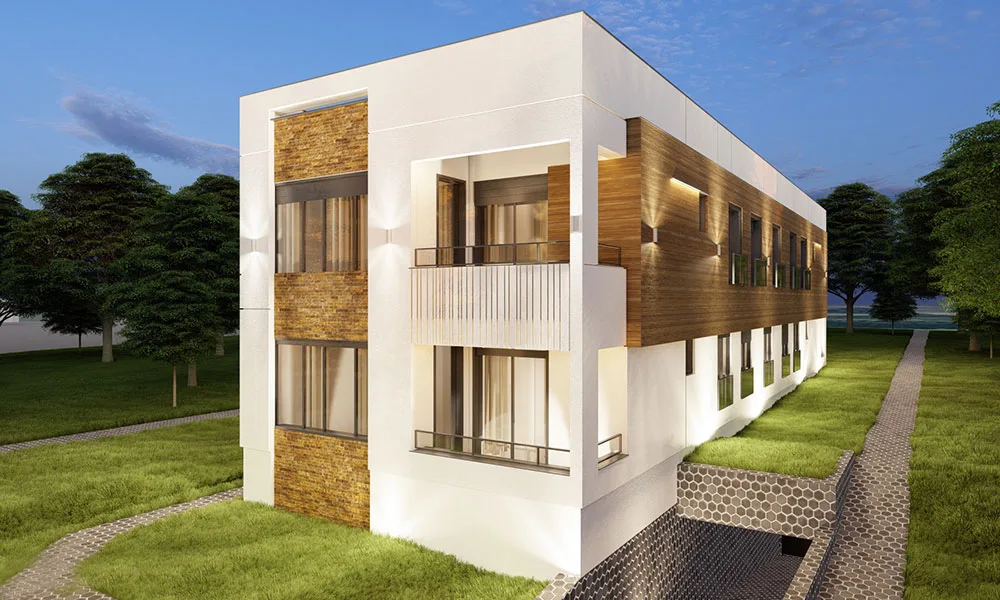
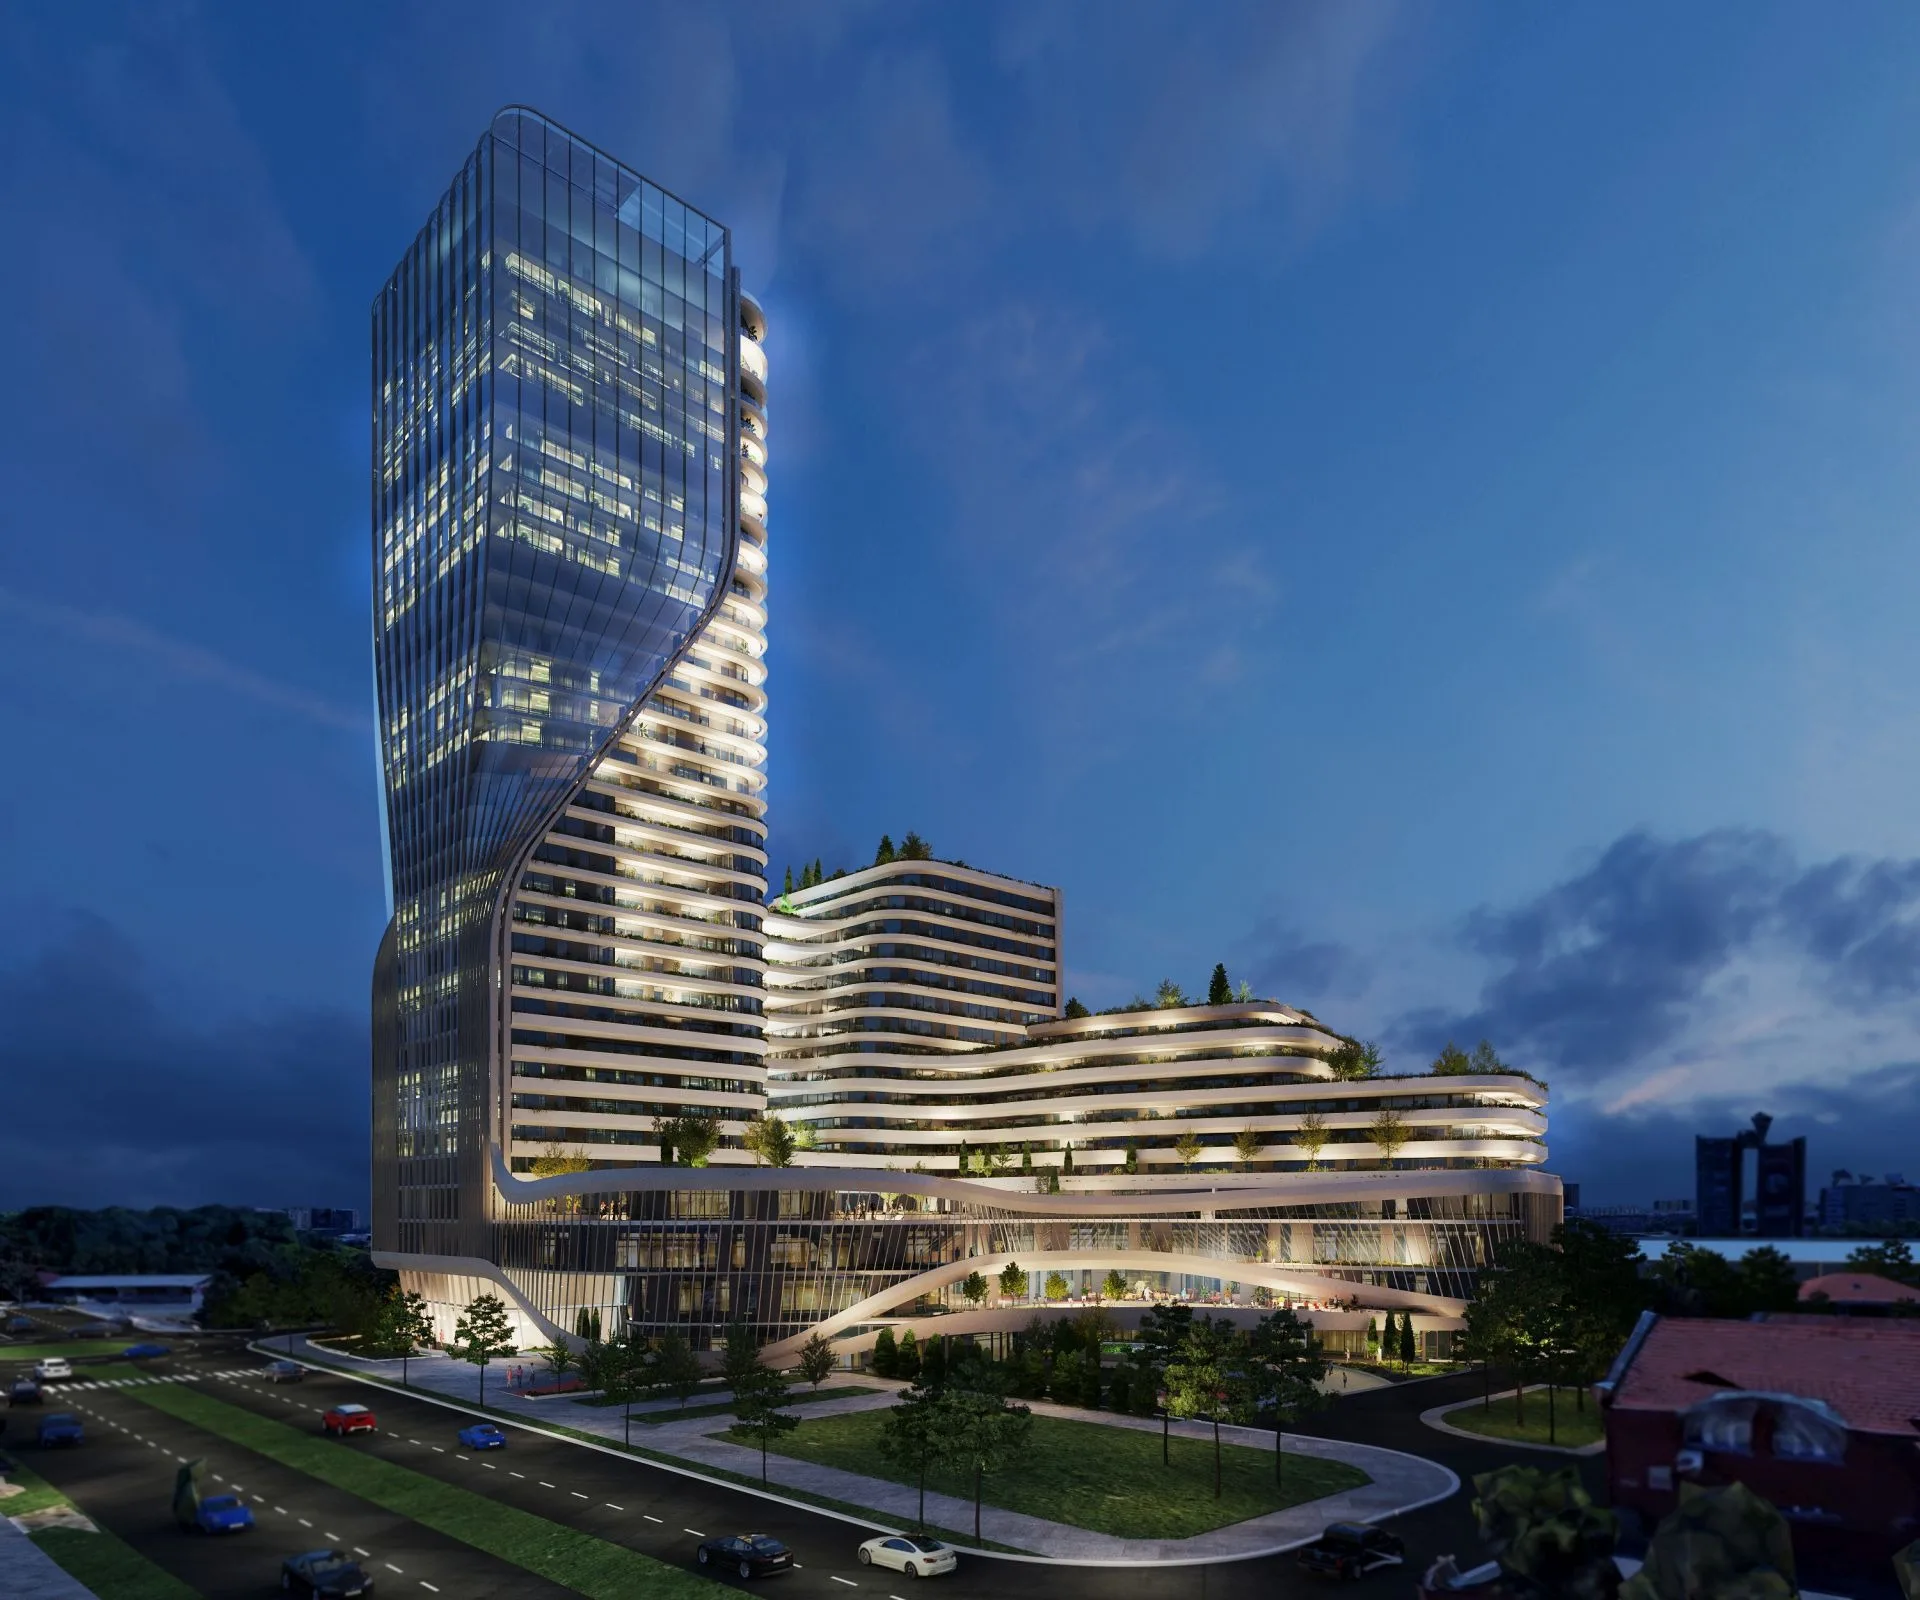
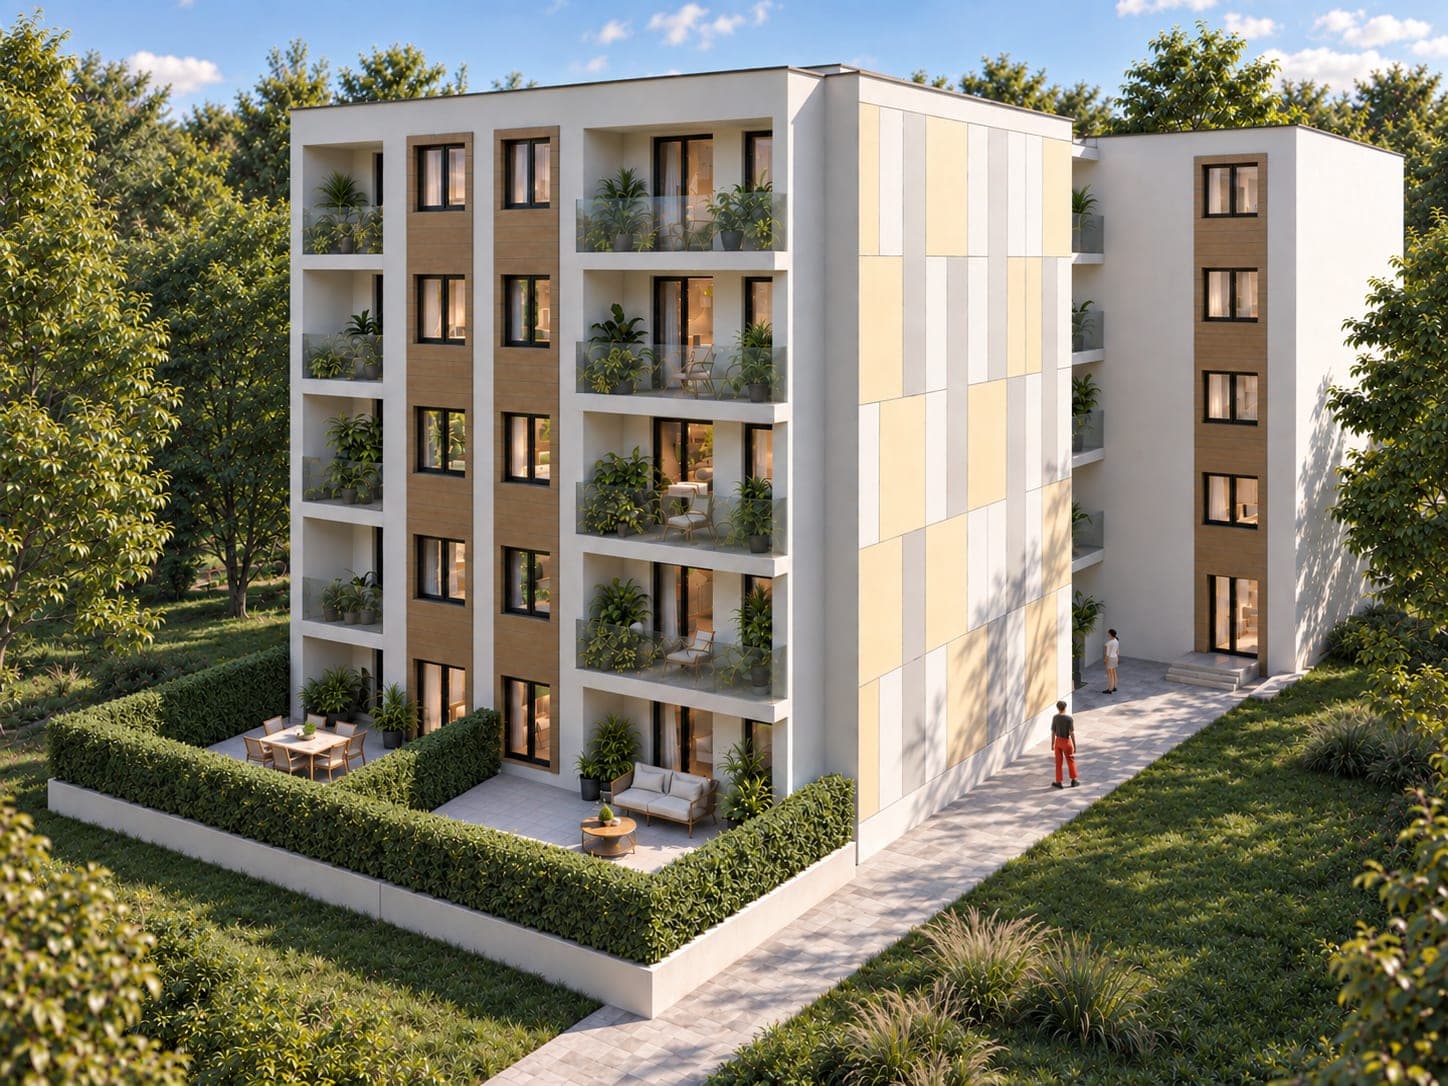
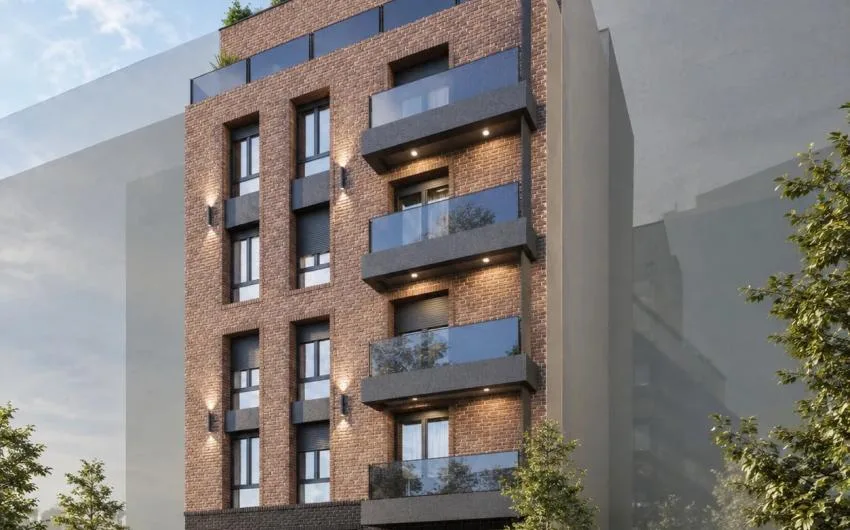
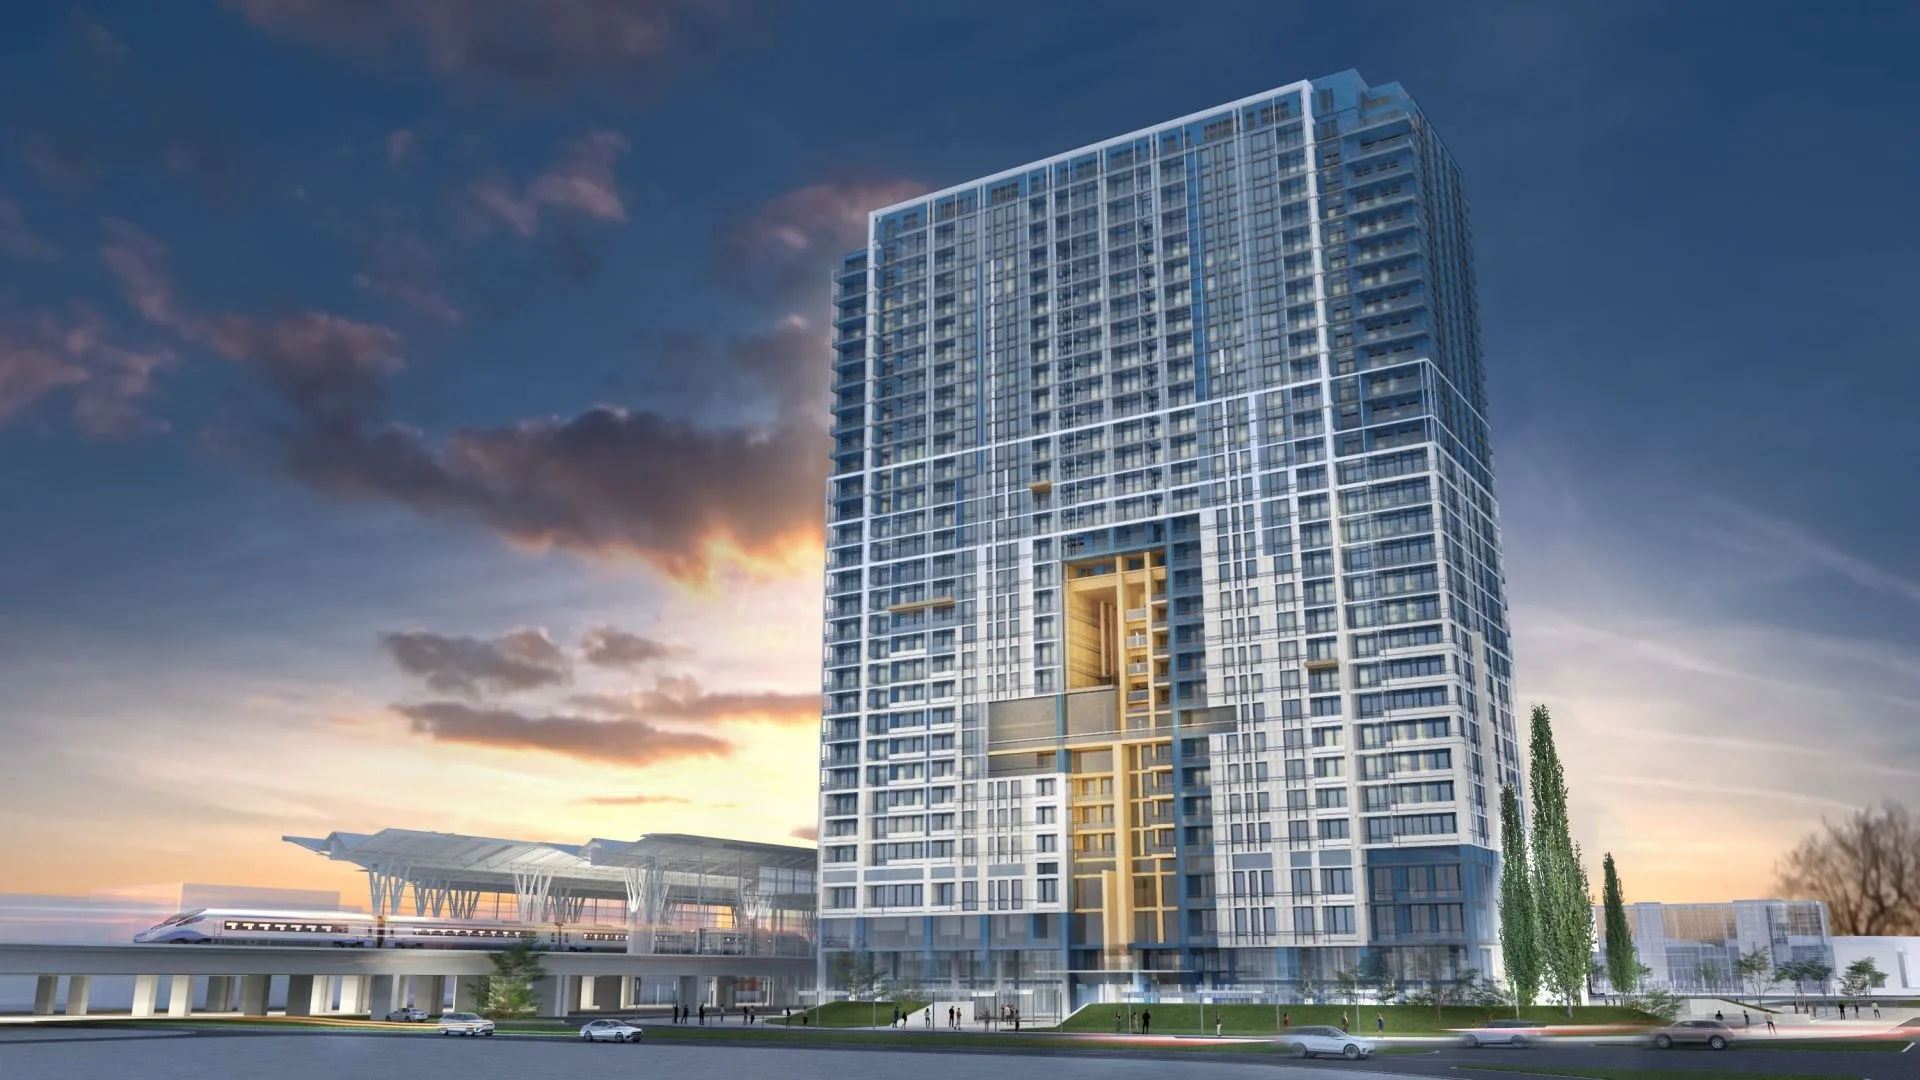
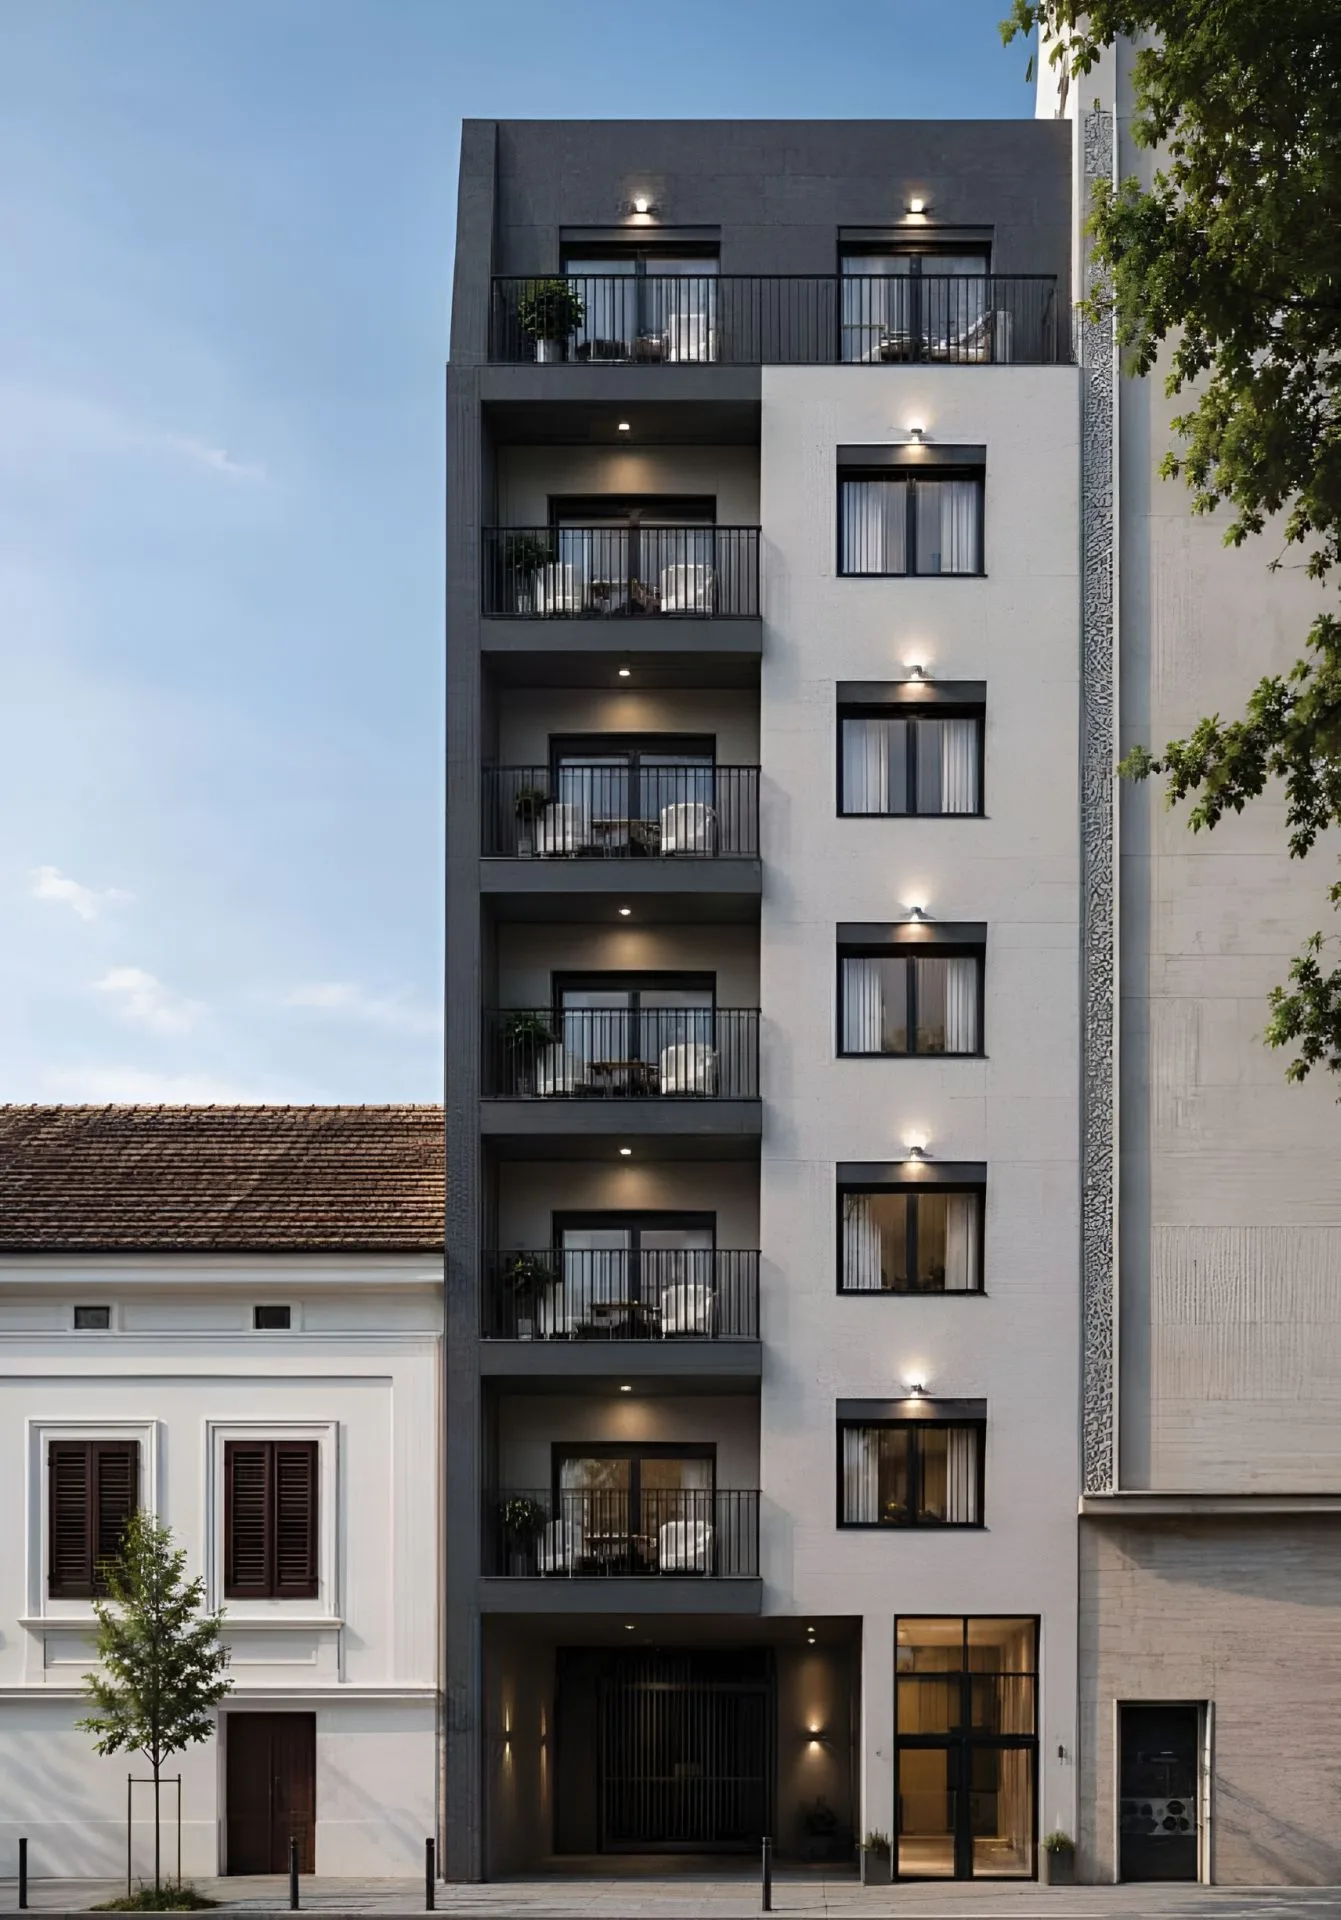
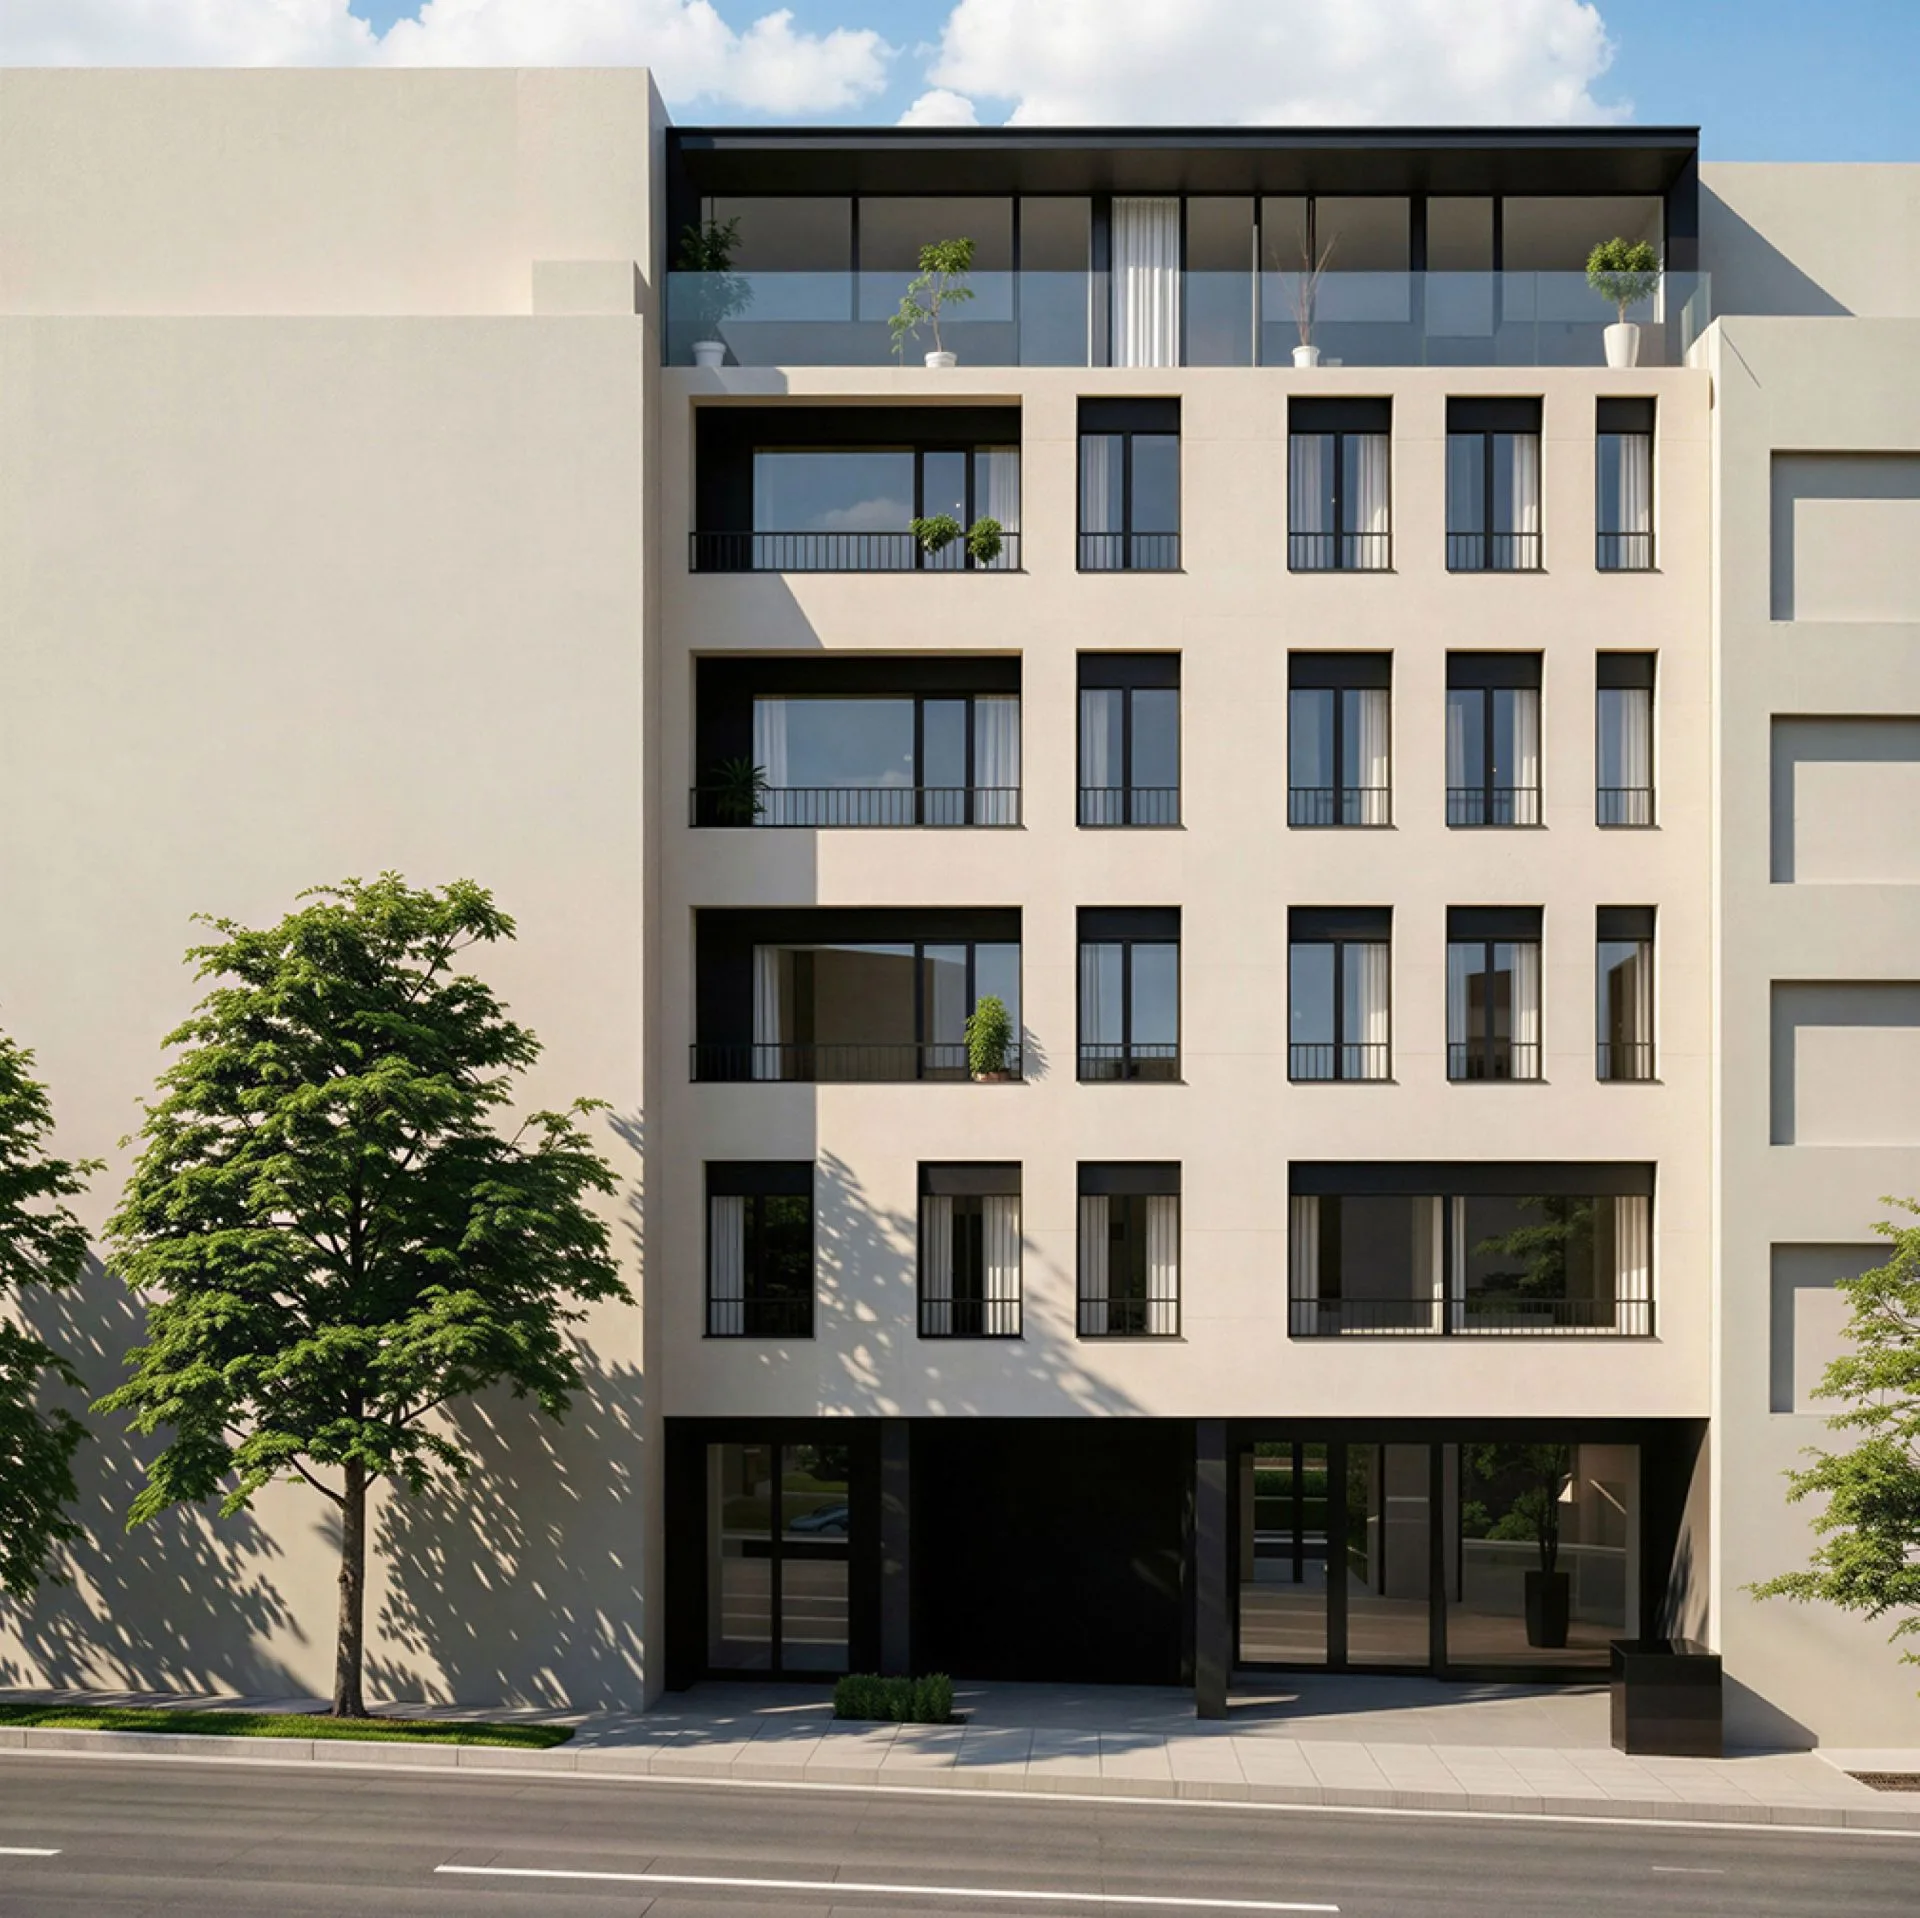
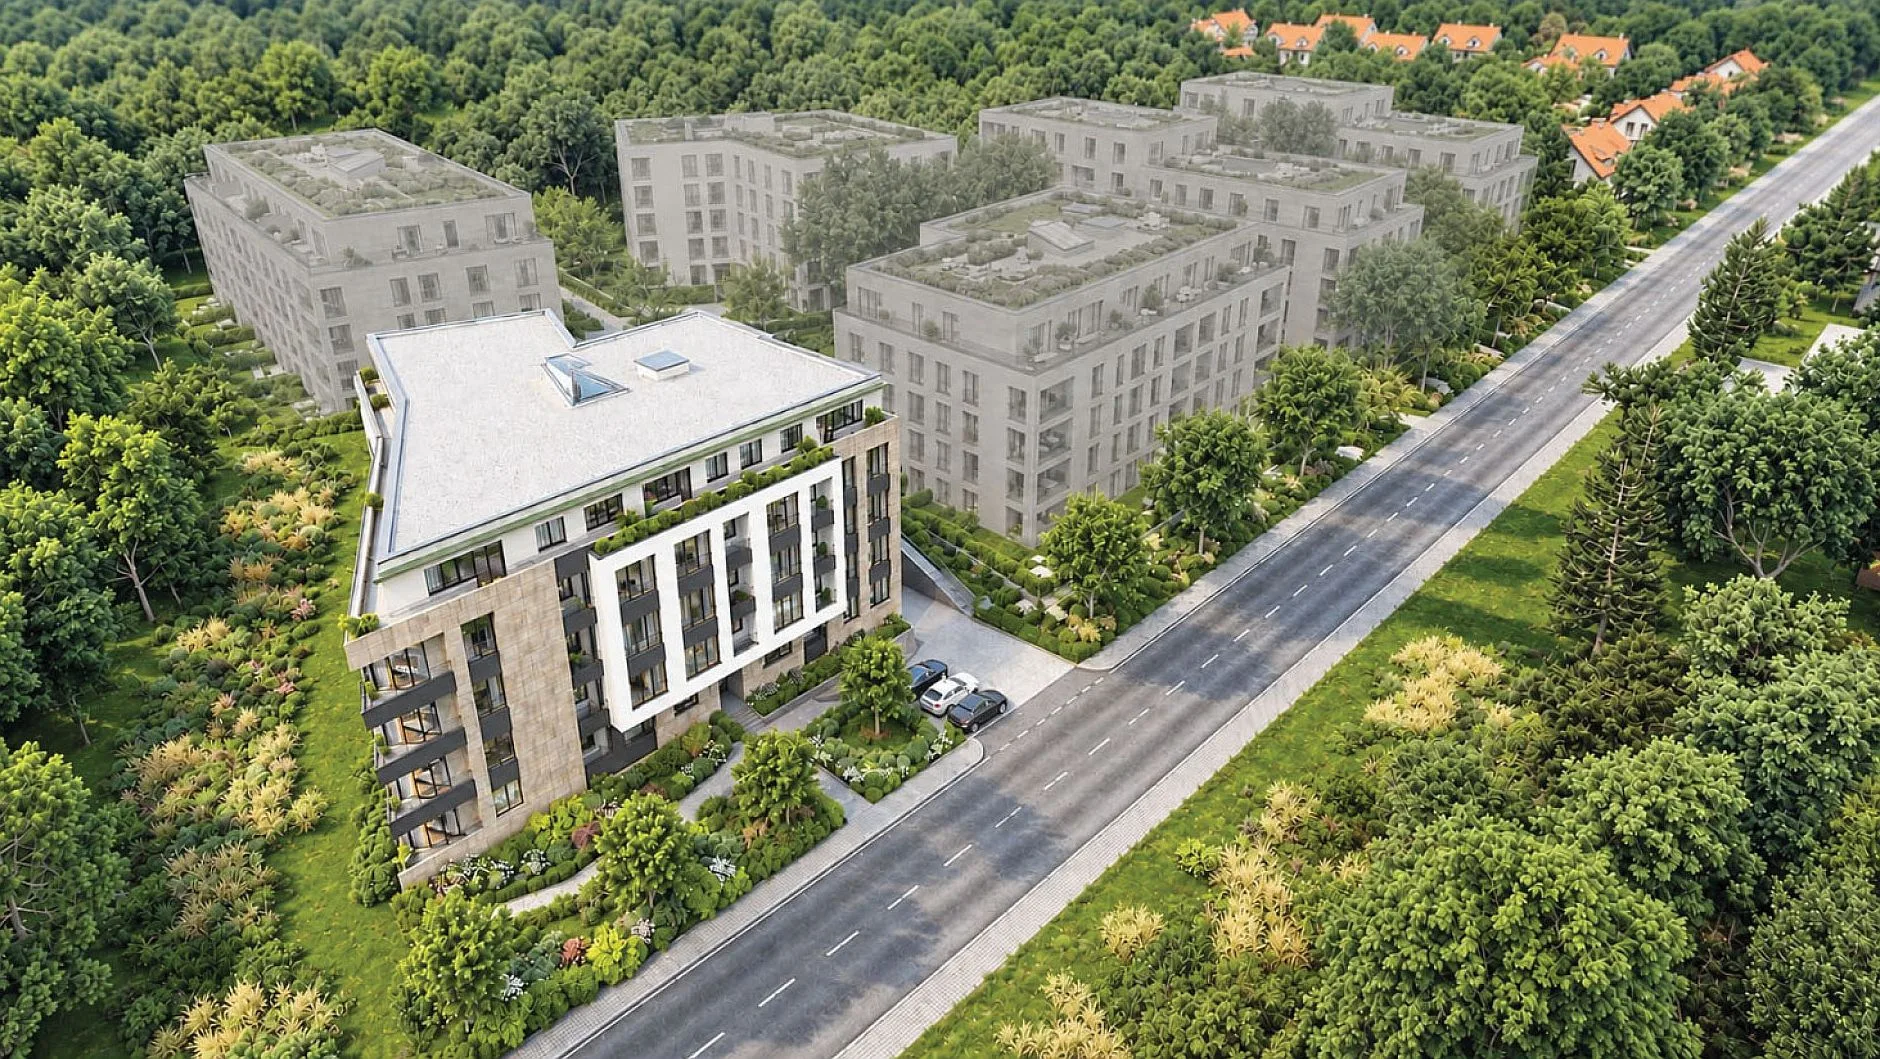
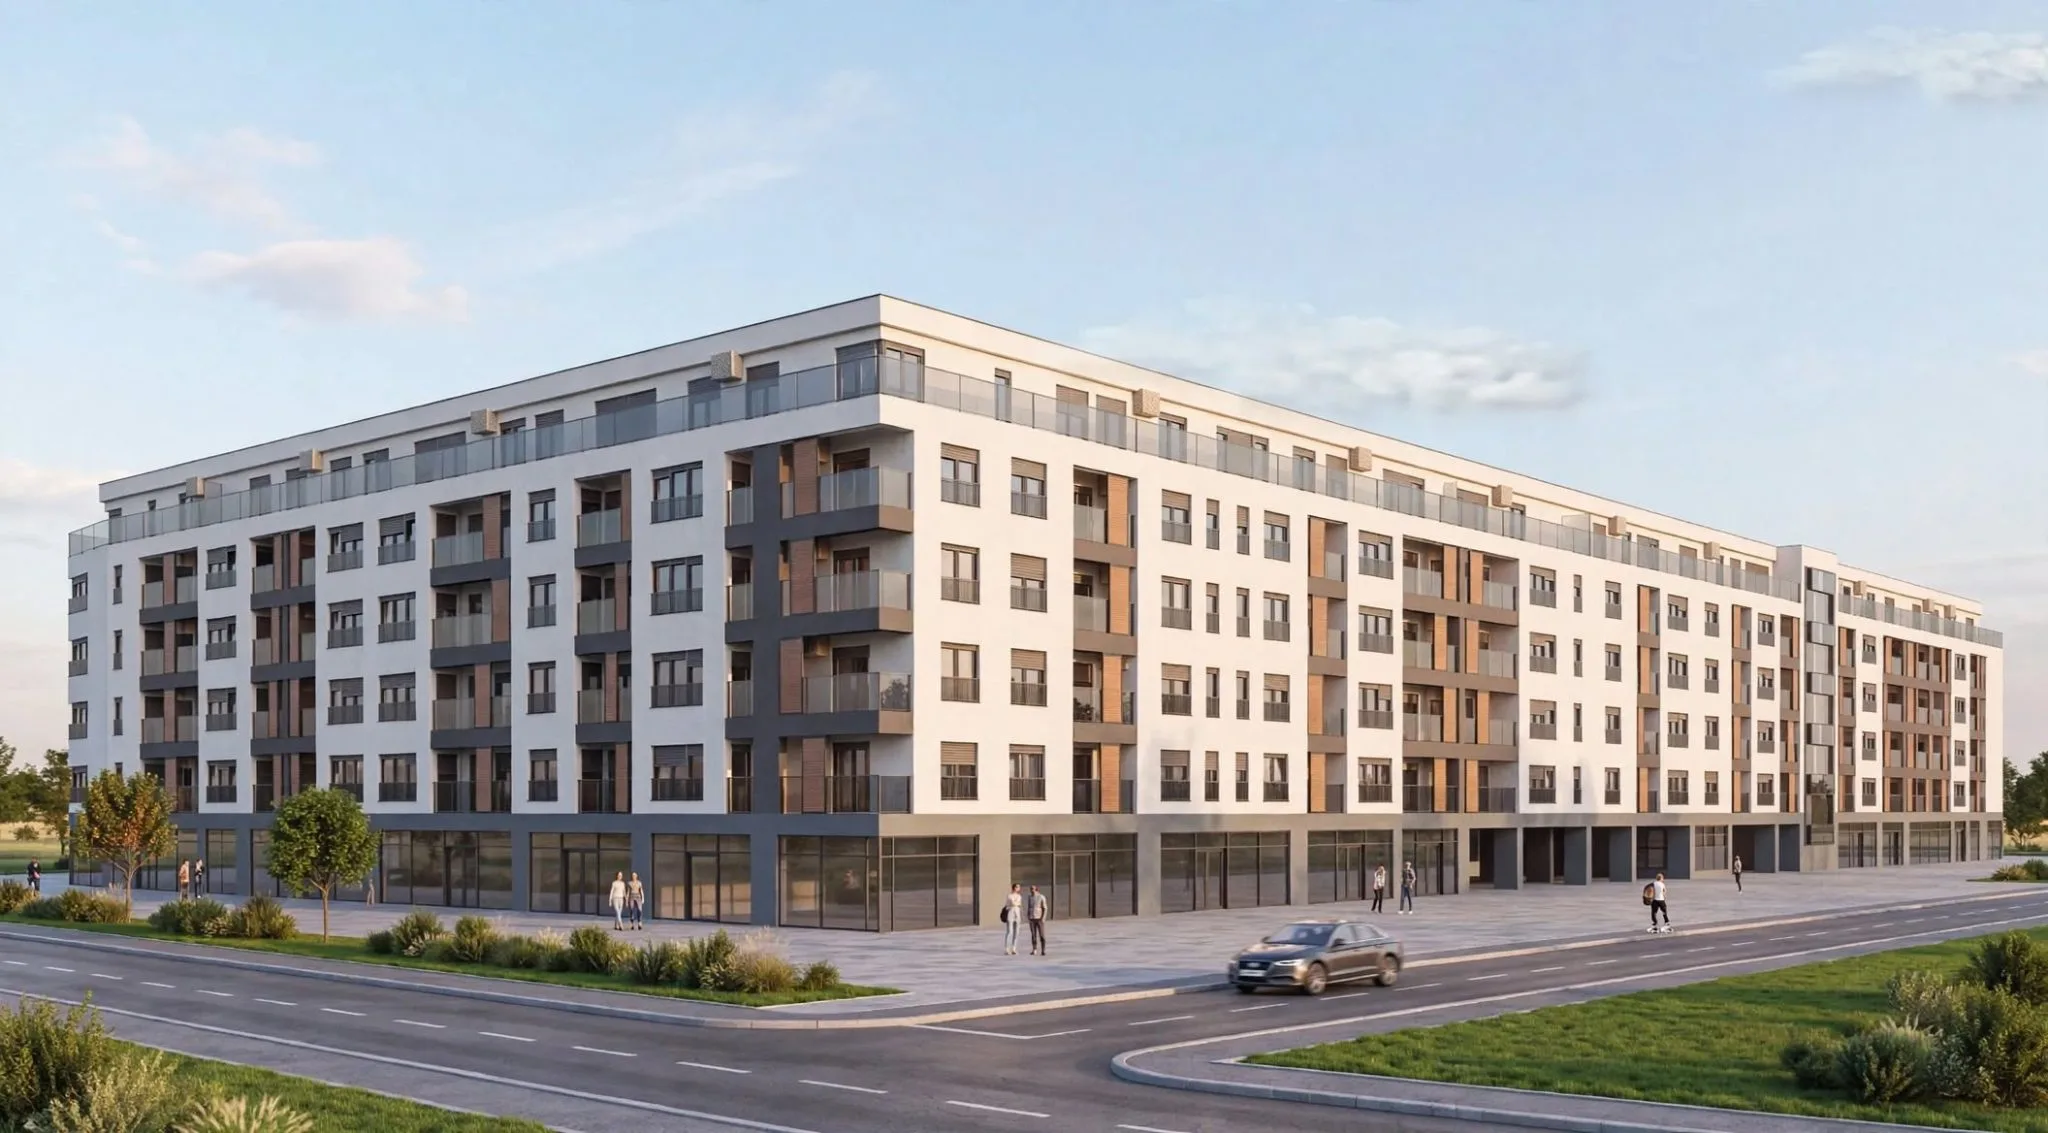
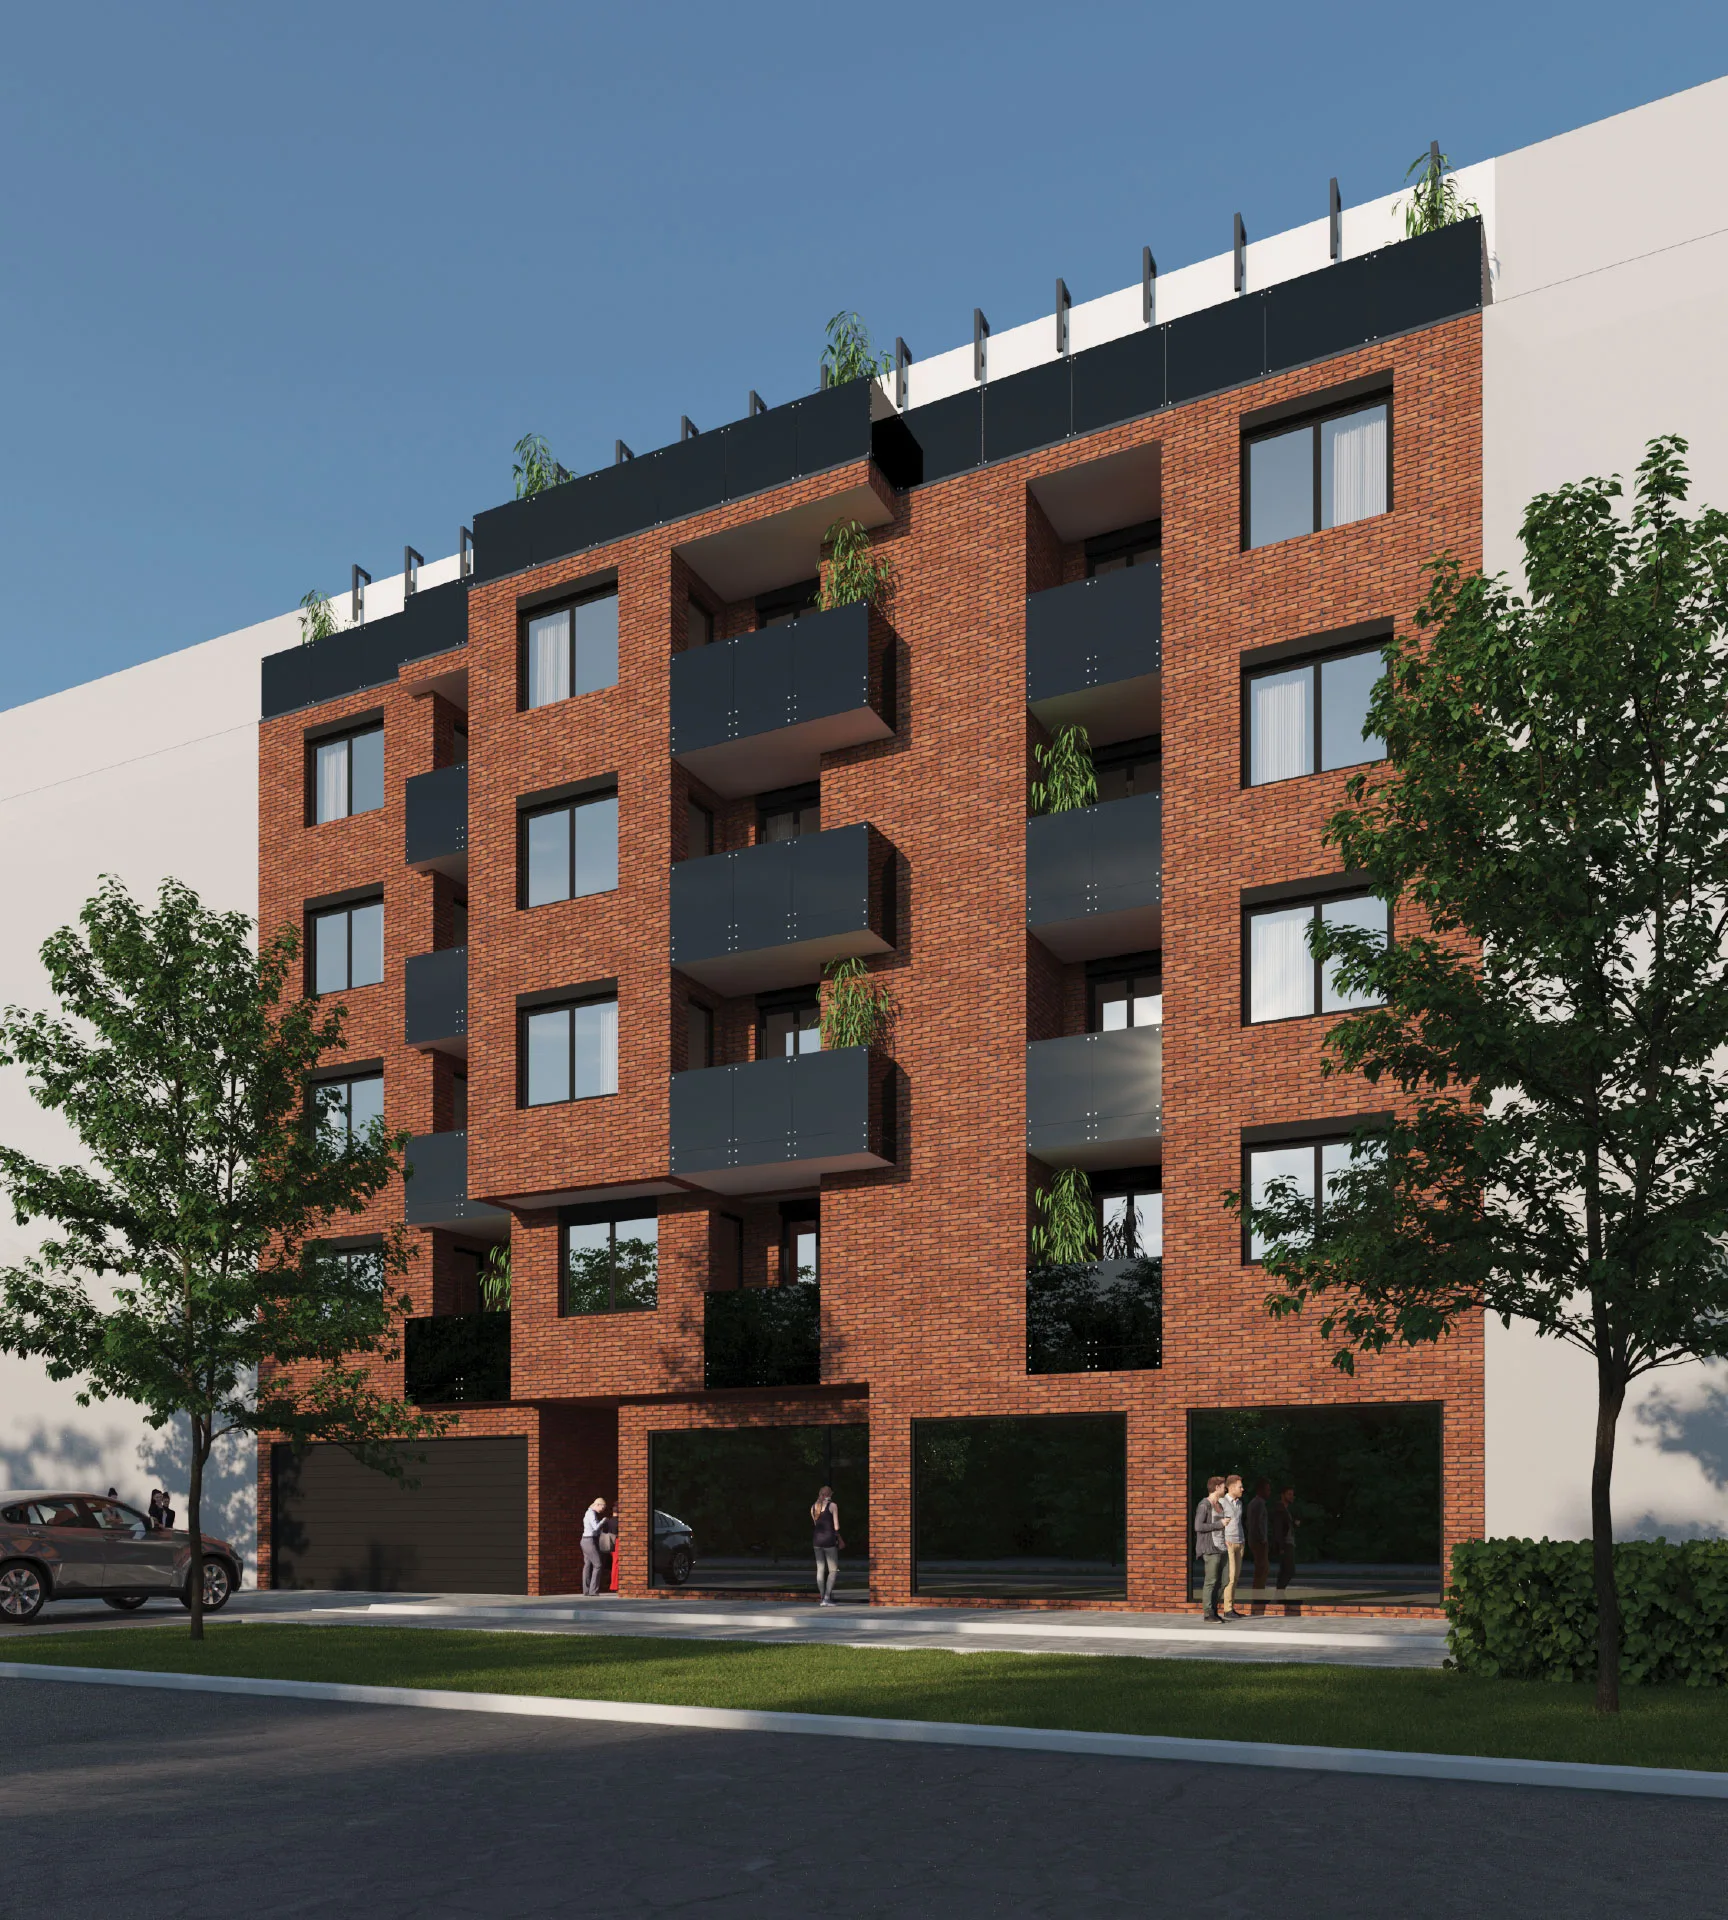
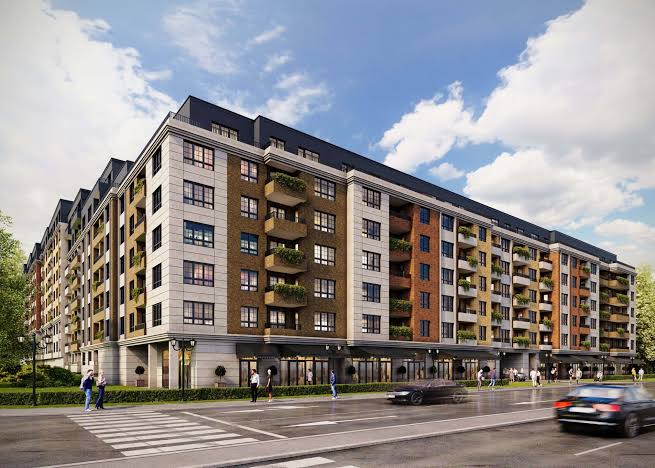
New developments in Belgrade
Methodology & sources
All figures are official statistics from the Statistical Office of Serbia (RZS): average achieved new-build prices per m² (semi-annual, per municipality, from the RGZ price registry), average net salaries (monthly), and building permits and completed dwellings (annual). Amounts in RSD are converted to EUR at the period-average exchange rate. Affordability = annual average net salary ÷ price per m². Administrative boundaries: RGZ / GeoSrbija open data.
Data as of
- RZS
- Aug 2026
- RGZ price register
- Apr – Jun 2026
- Census 2022
- 2022
- © OpenStreetMap
- 2022